【技术分享】PMT信号ADC采样后利用FPGA进行频谱分析
0赞Analysis of Energy Integration
· Purpose: We have developed three different ADC daughter boards using Linear, Maxim, and Analog device ADCs. Among them the Analog ADC daughter board was found to be best performing. Here we carry out several experiments to find optimal parameters for the energy-integration logic.
· Experimental Conditions: Analog ADC daughter board, single-pixel crystal
· Result:
1. Sampling in ADC: We have outputted samples by ADC, so we can understand the relation between trigger and peak and the amplitude of shaped signal in ADC. For this, we collected total 100 samples right after trigger. Fig. 1 shows multiple shaped signals obtained this way for before (a) and after (b) DC-offset corrected. The time interval between samples is 10ns, ADC sampling clock.
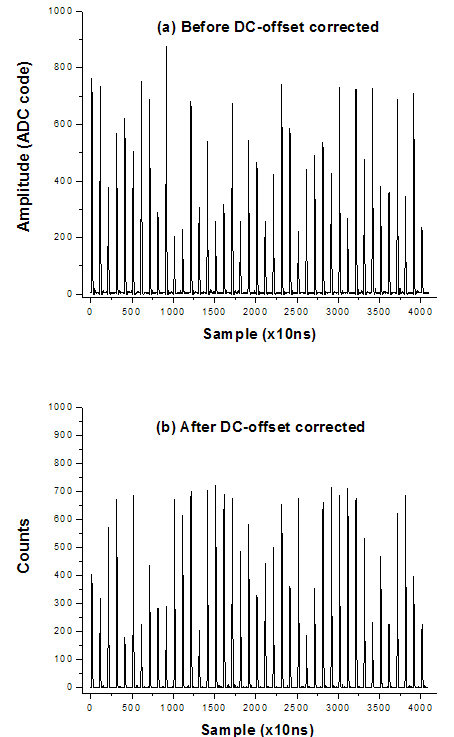
Fig. 1: Multiple shaped signals in ADC
2. Shaped pulse in ADC: Typical shaped pulse in ADC is shown in Fig. 2 ((a) Before DC-offset corrected (b) After DC-offset corrected). Its shape is consistent with the signal output from FEE, which implies that there is no signal distortion by ADC. The average DC-offset for this particular ADC channel is about 6 (ADC code).
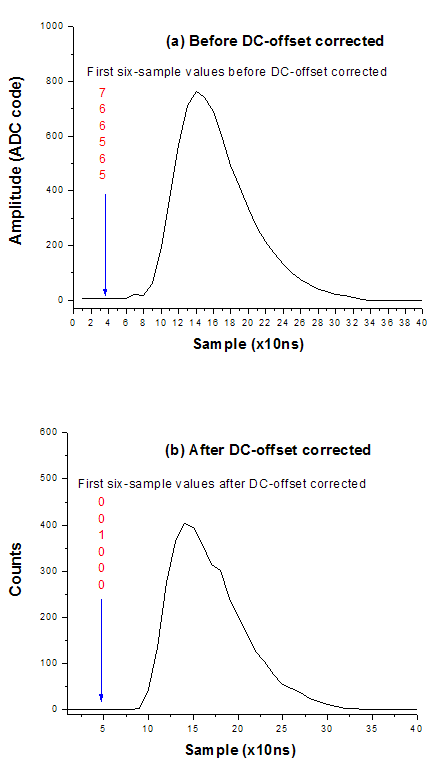
Fig. 2: Typical shaped pulse in ADC.
3. Energy spectrum with nine-sample integration: By observing pulse samples, we have chosen nine samples around the peak so that the sum of each pulse gives a maximal value. An example of energy spectrum acquired this way is shown in Fig. 3.
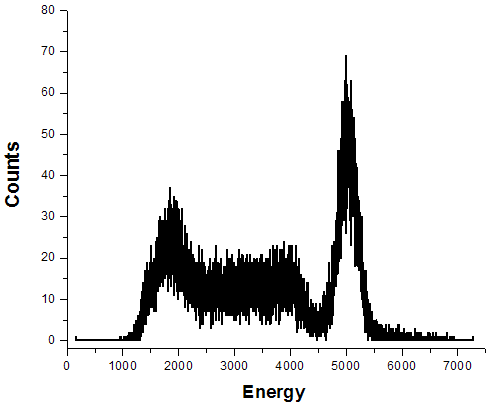
Fig. 3: An example of energy spectrum with nine-sample integration
Since we are going to use 9-bit energy, we need to rescale the energy by shifting 4 bits to the right in this case. The new energy spectrum obtained by shifting is shown in Fig. 4.

Fig. 4: Rescaled energy spectrum. It shows a high energy resolution (8%). Compared to the previous result from PPU (~10%), the energy resolution is much improved. It is most probably due to the new shaping unit and the new ADC daughter board with 10-bit resolution. The peak-to-valley ratio is high (11) as well, compared to the previous result.
4. Energy spectrum with 16-sample integration: Since the new electronics is designed to
handle high counting rates and the pulse width is about 200ns, it is desirable
to use more samples for energy integration. For this, we have chosen 16 samples for energy integration. A result before DC-offset corrected is shown
in Fig. 5 and its rescaled plot in Fig. 6.
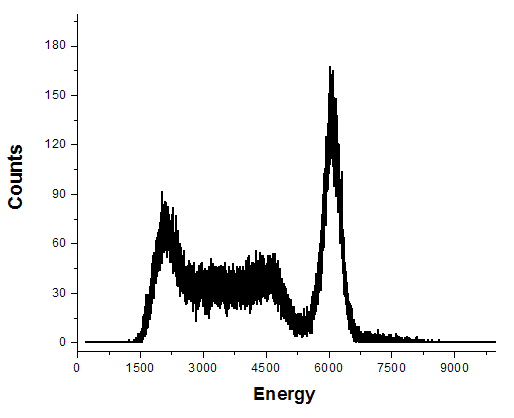
Fig. 5: Energy spectrum with 16-sample integration after DC-offset corrected
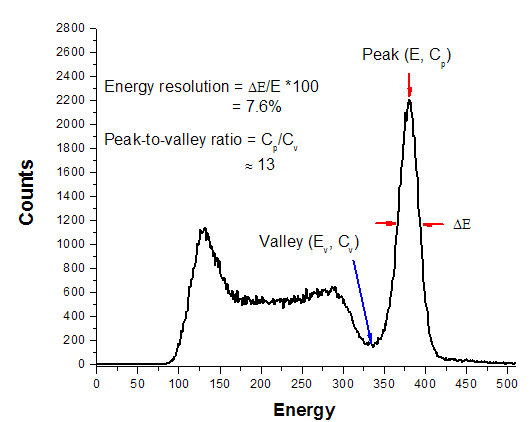
Fig. 6: Rescaled energy spectrum of the result in Fig. 5. As expected, the energy resolution and the peak-to-valley ratio are further improved to 7.6% and 13, respectively.
Another result after DC-offset corrected is shown in Fig. 7 and its rescaled plot in Fig. 8. In the case of one channel, the DC-offset value is constant, so that the energy spectrum is just translated to the higher side approximately by the average DC-offset value x 16-samples. This may result in a higher energy resolution as can be seen in Fig. 8.

Fig. 7: Energy spectrum with 16-sample integration before DC-offset corrected
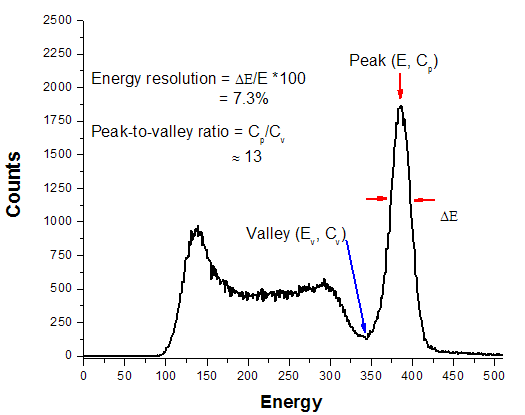
Fig. 8: Rescaled energy spectrum of the result in Fig. 7. The energy resolution and the peak-to-valley ratio are 7.3% and 13, respectively.
End of Document